Renewables
Renewable Power
Element 25 received funding under the ARENA 2019/ARP004 for a program "Pilot studies for Intermittent Dynamic Electrowinning using renewable energy".
Stage 2 of this program allowed for the collection and analysis of renewable energy sources at the company's Butcherbird Manganese Project.
Solar and Wind data was collected from site between 1 August 2019 and 31 July 2020.
The wind data was collected by a sodar unit, that collected 10-minute wind data. Solar data was collected by a Pyranometer, which collected 1-minute solar data points.
The key findings of the data is that the predominate wind direction is from the East and has an annual average wind speed at 100m of 6.9m/s.
The solar resource has an annual climatology of 22.1 MJ/m2.
The solar data collected on site correlates well with that for the nearby Ilgarari Bureau of Meteorology (BOM) station located approximately 15km from the Butcherbird Mine Site.
Longer term data collection will assist with reducing uncertainty associated with the data, however, preliminary modelling has been performed with the initial data collection.
Wind Data
Wind data was collected by a Triton T1086 Sodar unit. The pyranometer was installed in the western half of the Butcherbird Renewables area at Lat: -24.433080 South, Lon: 119.715176 East, Elev: 610.9m ASL, approximately 30m from the Sodar unit.

Figure 1. Triton Sodar Installed at Butcherbird
The Triton Sodar collected 66,354 x 10-minute spaced wind data points over 493 days. The wind data collected included wind speed, both horizontally and vertical speeds, and wind direction. Data was collected every 10 vertical metres from 50m to 200m above ground level.
This data showed an average wind speed of 7.3m/s2 with a Standard Deviation of 2.6m/s2. Maximum individual readings of 19.0m/s2 and Minimum readings of 01.m/s2.
This is shown graphically below:

Figure 2. Butcherbird Annual Wind Speed at 100m
The variability of the wind against time of day across the year is shown below:
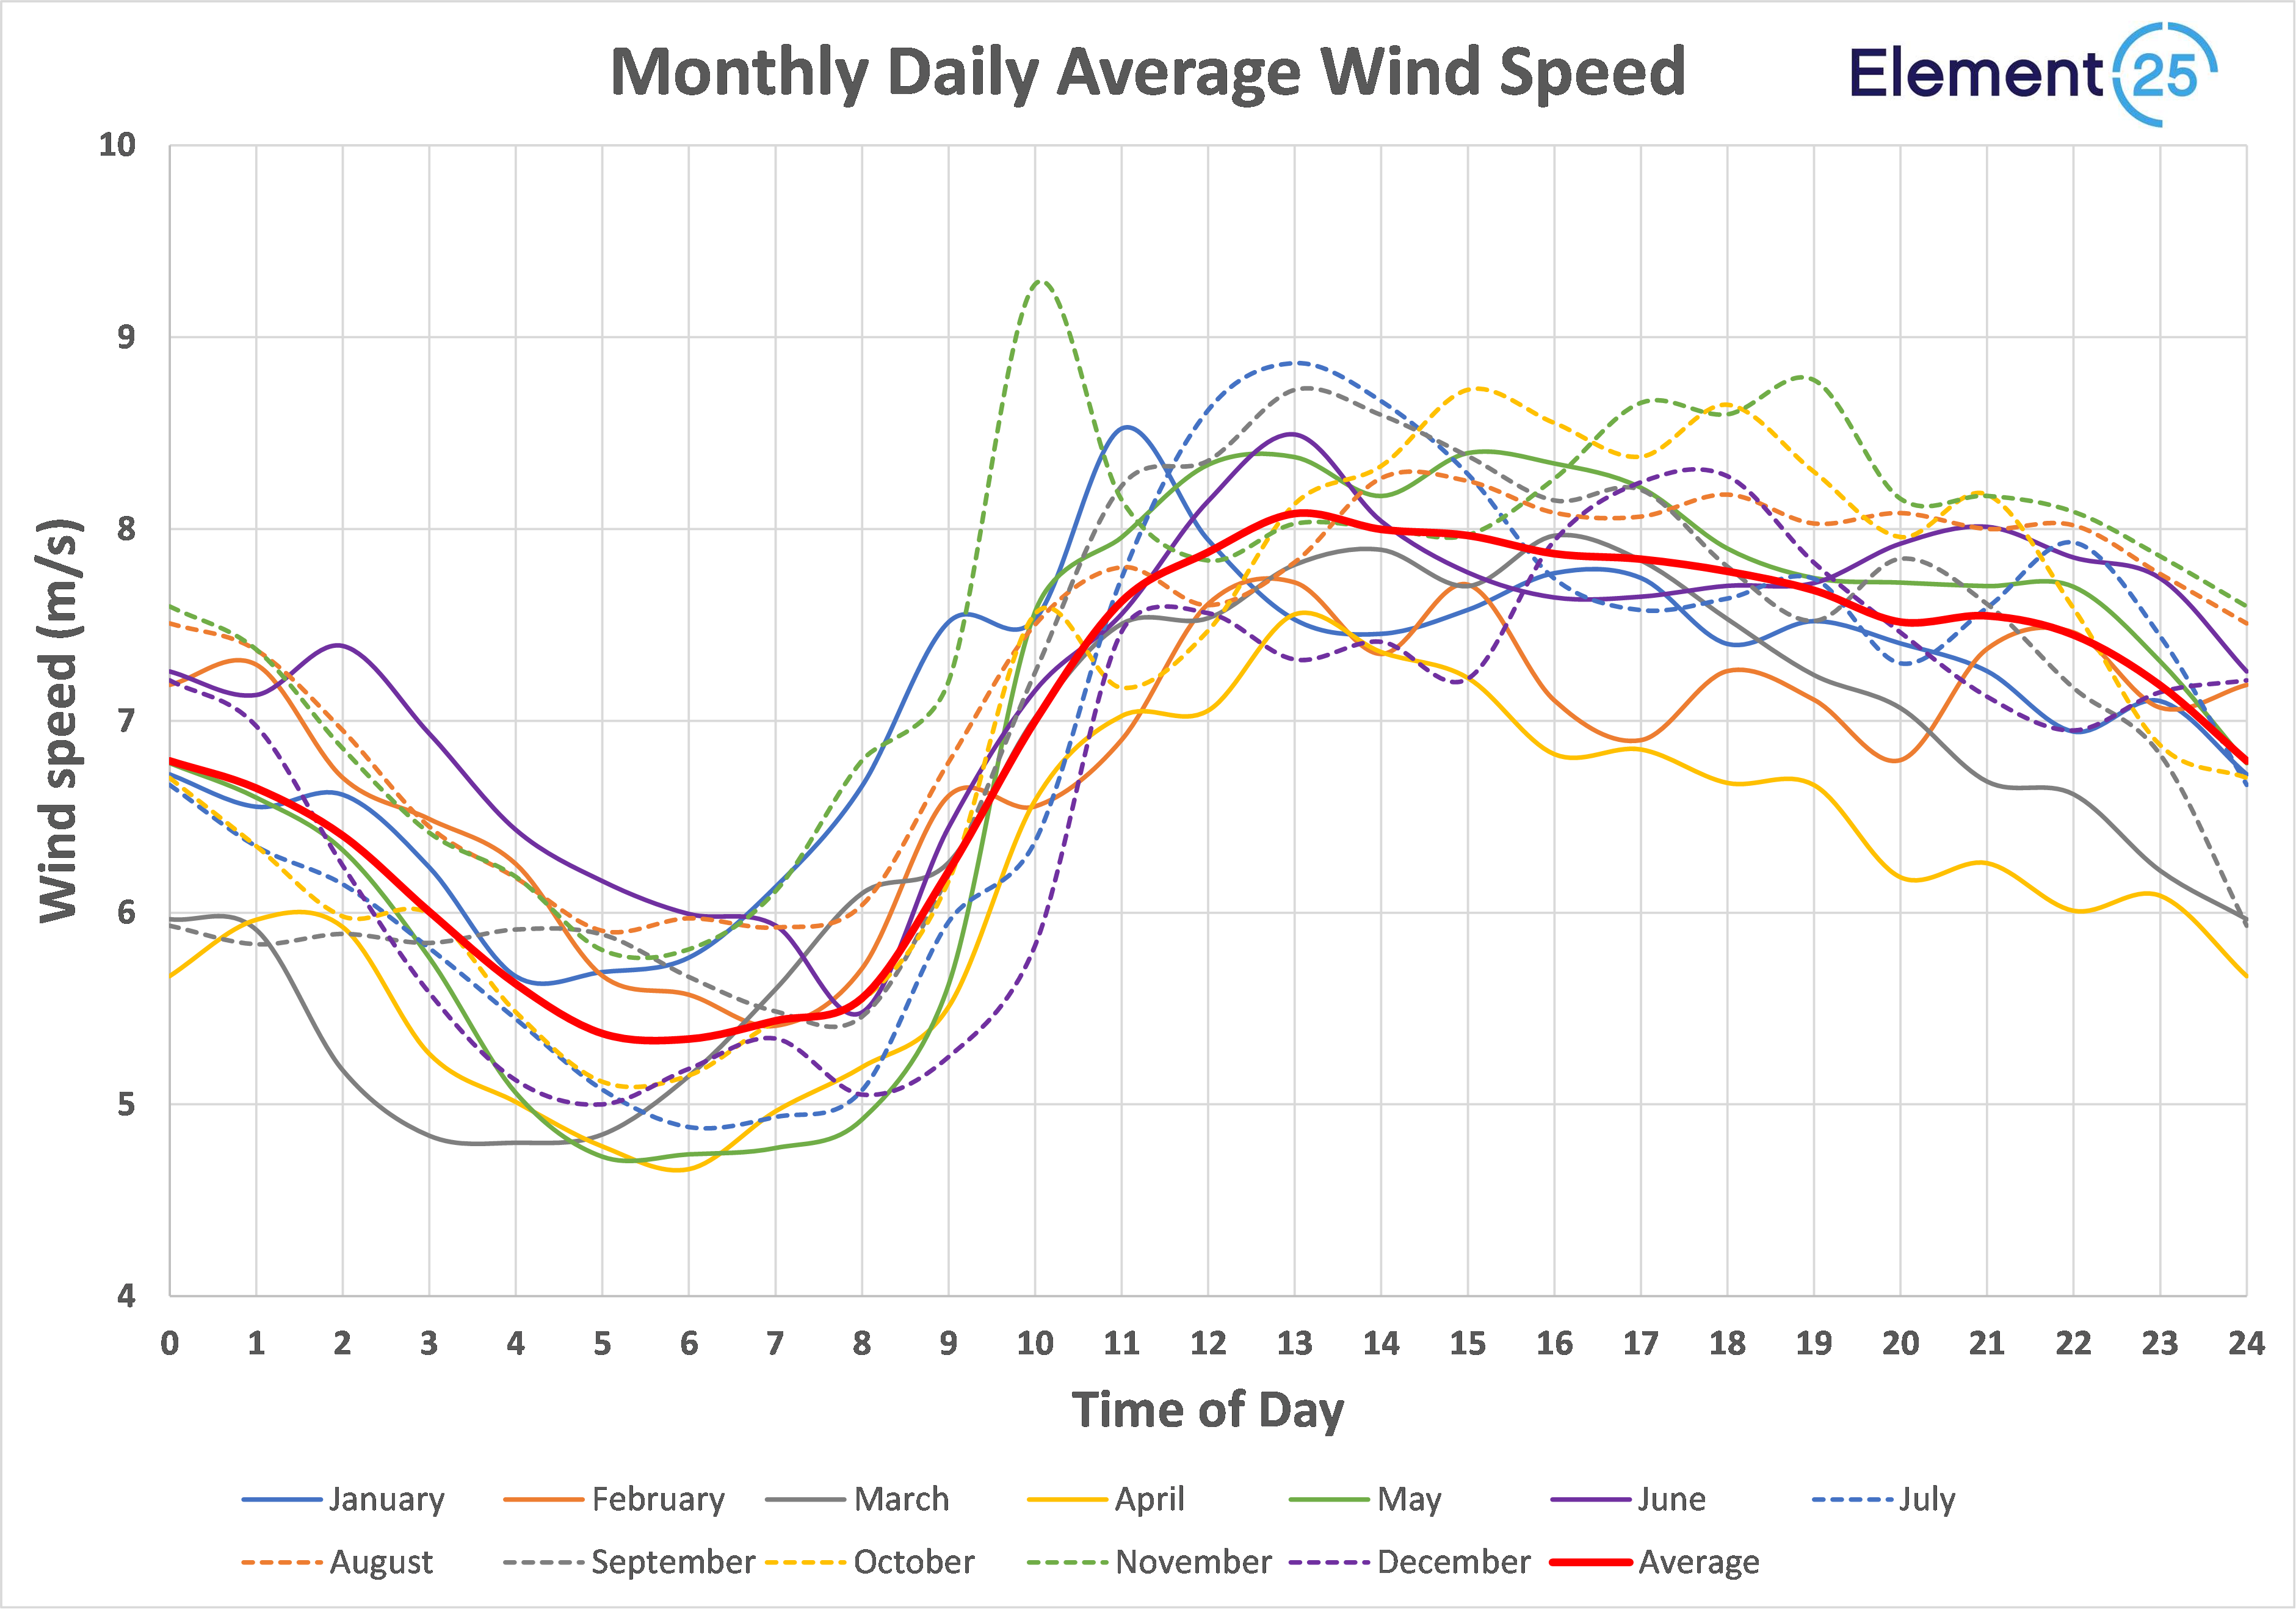
Figure 3. Butcherbird Average Wind Speed - Monthly Variability versus time of Day at 100m
Solar Data
Solar radiation data was collected by a Kipp & Zonen CMP 3 pyranometer, installed on a Campbell Scientific CM106B Tripod. The pyranometer was installed in the western half of the Butcherbird Renewables area at Lat: 24.433180o South Long: 119.714828o East.

Figure 4. Pyranometer installed at Butcherbird with Sodar unit in the background.
The Pyranometer collected 1-minute spaced solar data readings over the collection period.
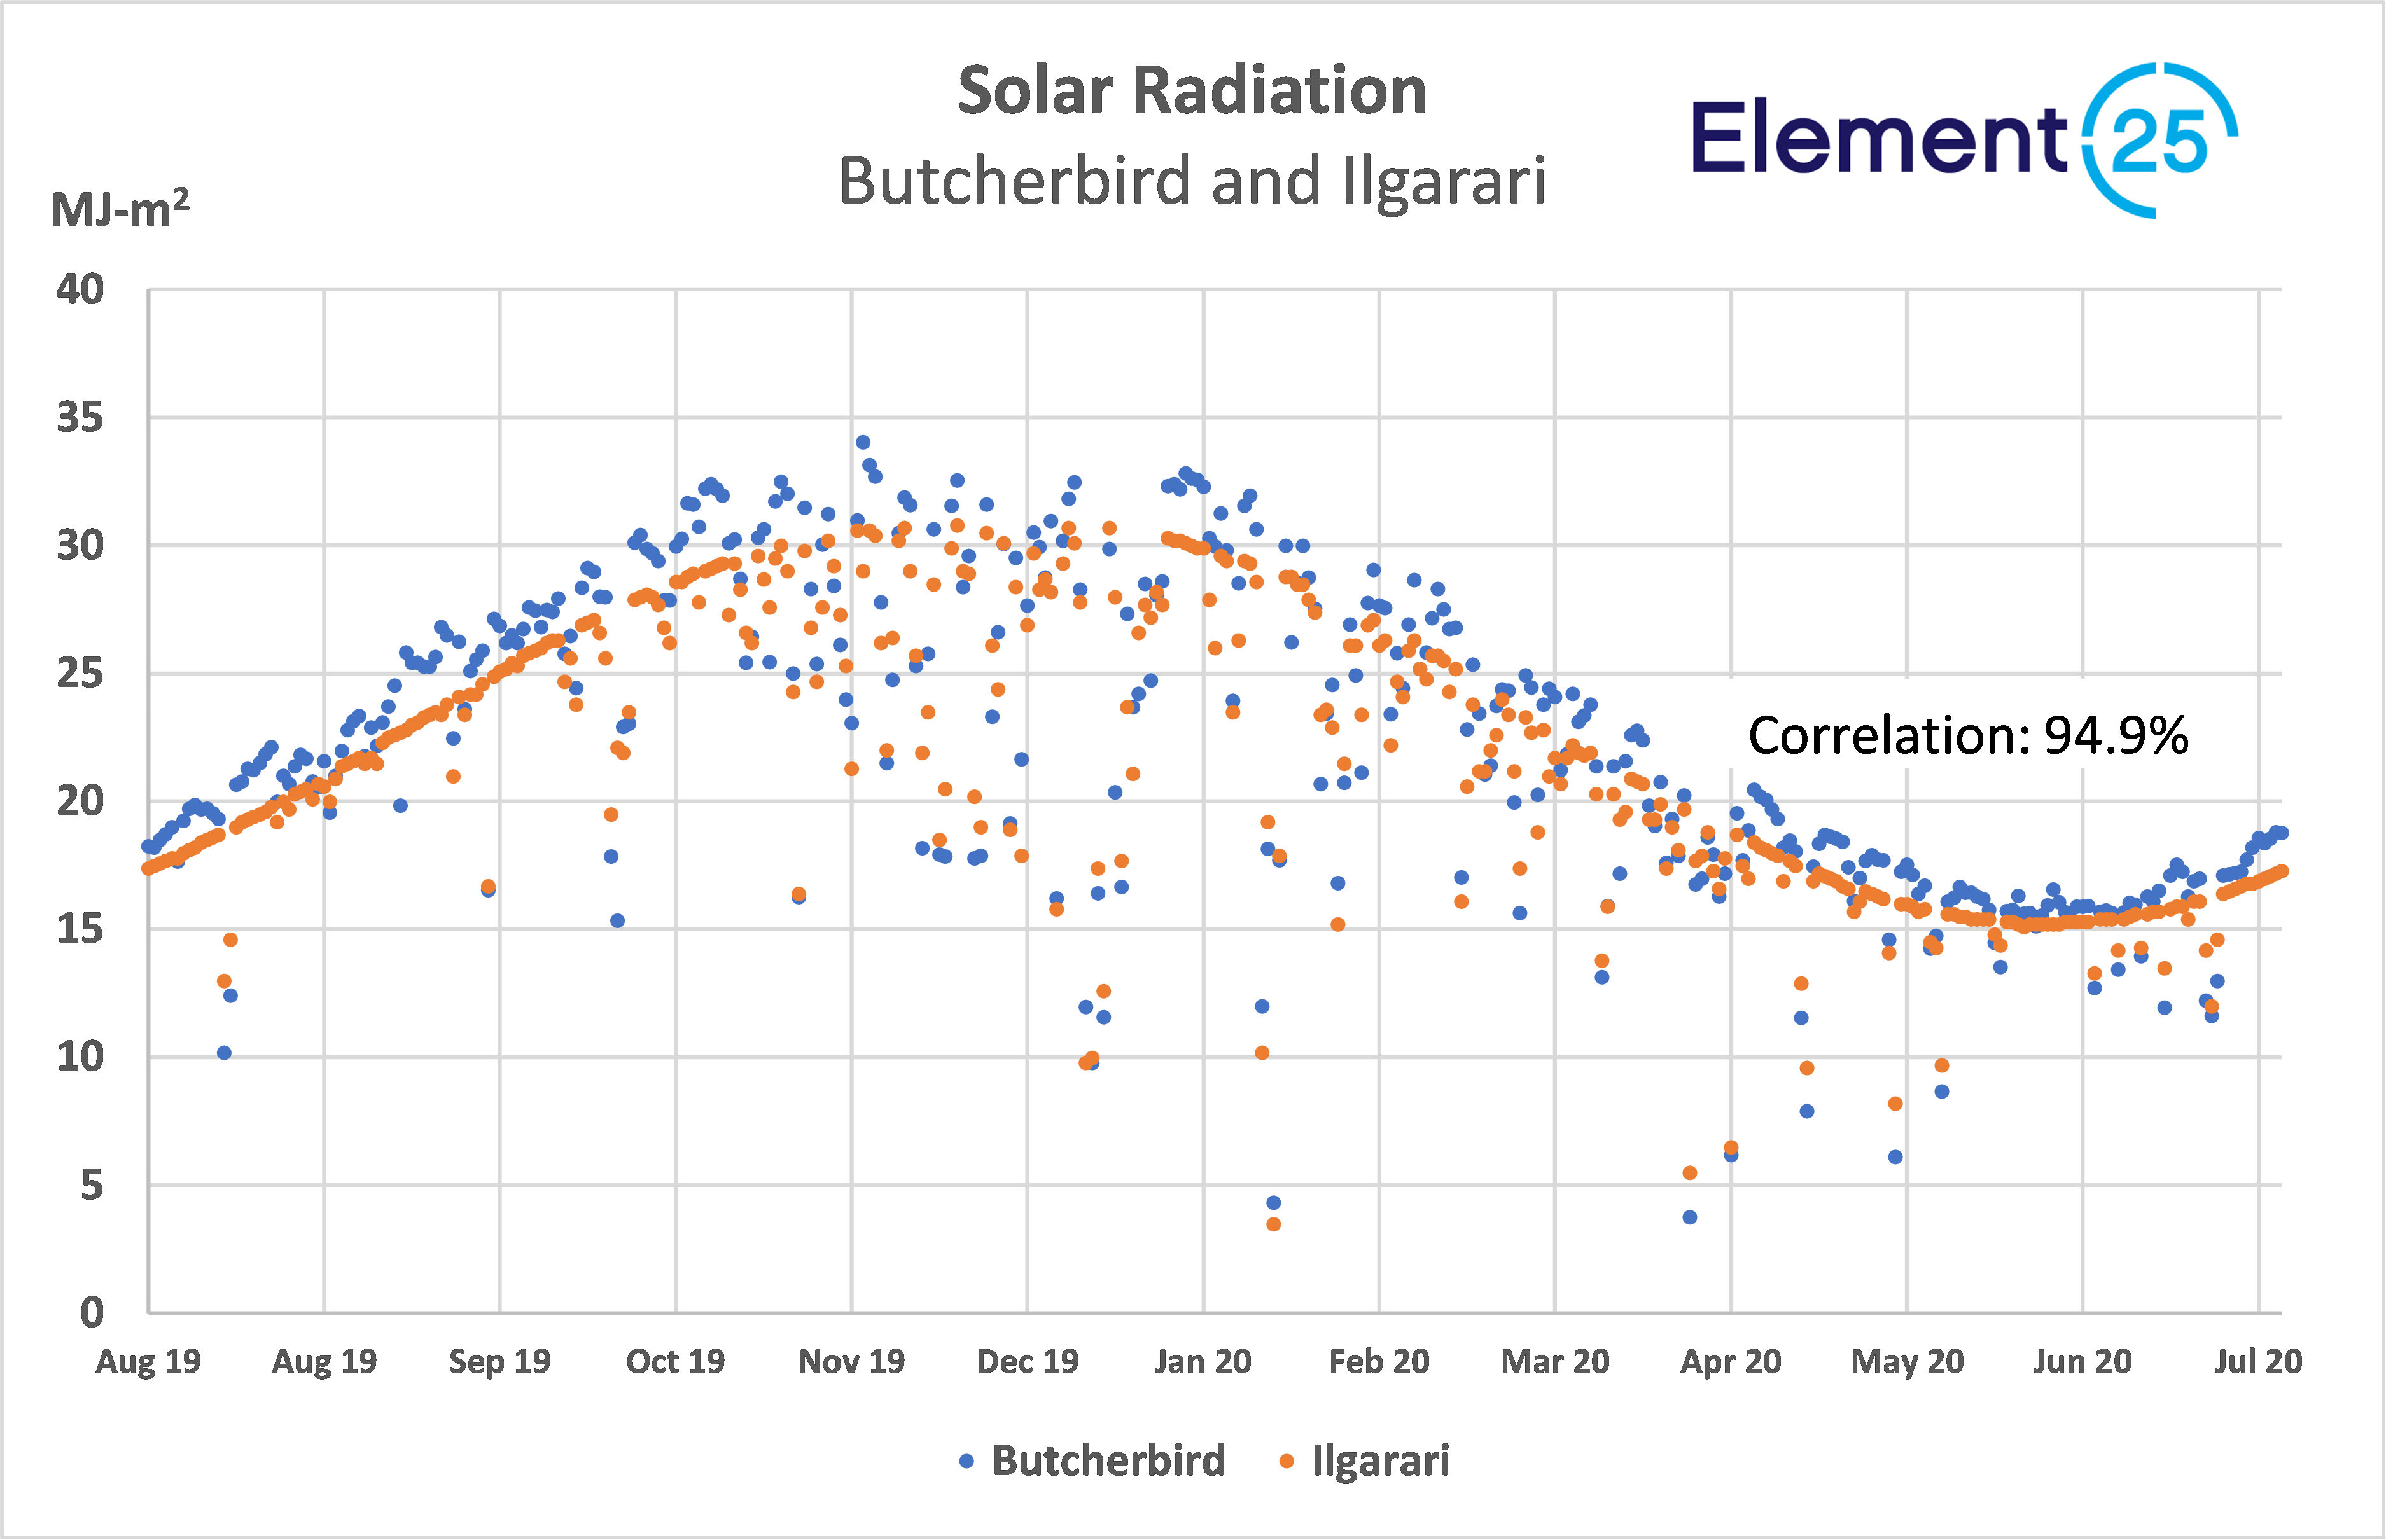
This data showed an average solar radiation collection of 2.4 MJ/M2. Maximum of 34.0 MJ/M2 and Minimum of 3.8 MJ/M2. The data was compared to the Ilgarari BOM meteorological station which is located 16km from the Butcherbird site and shows a correlation of 94.9%.
This is shown graphically below:
Renewables Data
Element 25 has committed to making the data available to assist research and other users who have a need for using real renewables data from a Southern Pilbara location.
The data files supporting the above information can be downloaded from this link: Download Data.


